This page describes the basics of using the Chart API to make charts.
Google Chart Usage Policy
There's no limit to the number of calls per day you can make to the Google Chart API. However, we reserve the right to block any use that we regard as abusive.
Table of Contents
Getting Started
The quickest way to make a chart for your web page is to use our new chart
wizard. Copy and paste the URL generated by the wizard into
your web page inside an <img> tag.
For more advanced users, for chart types or features not supported by the wizard (such as candlestick charts), or for a deeper understanding of how the API works, read the rest of this page.
Overview
Viewing Charts in This Documentation
All the chart images in this documentation are generated live, using the Chart API. To view the URL of any image, do the following:
- If you are using Firefox, right-click and then select "View Image" or "Properties".
- If you are using Internet Explorer, right-click and then select "Properties".
To make a URL easier to read, this document often shows it on multiple lines. When you are using the Google Chart API, you must supply a URL on a single line.
The Google Chart API returns a chart image in response to a URL GET or POST request. The API can generate many kinds of charts, from pie or line charts to QR codes and formulas. All the information about the chart that you want, such as chart data, size, colors, and labels, are part of the URL. (For POST requests, it's a little different, but don't worry about that now).
To make the simplest chart possible, all your URL needs to specify is the chart
type, data, and size. You can type this URL directly in your
browser, or point to it with an <img> tag
in your web page. For example, follow this link for a pie chart:
https://chart.googleapis.com/chart?chs=250x100&chd=t:60,40&cht=p3&chl=Hello|World
The preceding link is an example of a basic Chart API URL. All Chart URLs have the following format:
https://chart.googleapis.com/chart?cht=<chart_type>&chd=<chart_data>&chs=<chart_size>&...additional_parameters...
All URLs start with https://chart.googleapis.com/chart? followed
by the parameters that specify chart data and appearance. Parameters are name=value pairs,
separated by an ampersand character (&), and parameters can
be in any order, after the ?. All charts require at
minimum the following parameters: cht (chart
type), chd (data), and chs (chart size). However, there
are many more parameters for additional options, and you can specify as many additional
parameters as the chart supports.
Let's examine the URL above in more detail:
| URL | Components |
|---|---|
|
|

Copy and paste this URL in your browser and try making a few changes: add additional
values to the data (don't forget to add a comma before each new data value). Add
new labels (put a | mark before each new value). Make the chart bigger.
How To Make a Chart
You can make a chart using the chart wizard, or manually by writing the URL by hand. You might want to start by using the wizard, and then tuning the results manually for features not supported by the wizard.
Using the Chart Wizard
The chart wizard is located here. It might still be useful to read the following topics even if you use the wizard:
- Data Formats, for an understanding of why to use one data format over another
- The details page for your specific chart type, if you want to learn more about what you can do with that chart type
- POST requests, if you want to make a POST version of your chart, instead of a GET version
- Creating a
<map>of your chart, if you want to add interactivity to your chart
Creating a Chart Manually
Here is a summary of how to make a chart manually:
- Decide on a chart type. See the gallery for a list of charts;
chart type is specified by the
chtparameter. Sketch out all the components that you want your chart to have (axes, labels, backgrounds, and so on), and if necessary, figure out pixel dimensions for the various components (total chart size, legend size, and so on). You should read the documentation carefully for your chart type first, or you might have a frustrating experience. - Create and format your chart data. Data
is specified using the
chdparameter. You'll need to decide which format to use for your data:- Choose a data format. You can use simple text format for your chart data, which is easy to read, but takes more space to send, or use one of the encoding types, which is smaller to send, but restricts the range of values you can send.
- Decide whether your data must be scaled to fit your chart. Different formats support different ranges of values. You might want to scale your data so that it spans the full range of values allowed by your format, to make differences more obvious. You can do this either by scaling your data to fit within the data format that you use, or you can use text formatting with custom scaling.
- Encode your data, if necessary. If you've chosen an encoded format, we offer some JavaScript to help with other encoding types.
- Specify the chart size. Chart size is specified using the
chsparameter. See the documentation for the format, and maximum values. - Add additional parameters. Each chart's documentation lists
the available optional parameters. Typical options include labels, titles, and
colors. Note that all label or title text must be UTF-8 encoded. Note that many
parameters allow you to enter multiple values. For example, the
chmparameter lets you put a shape on a single data point on a chart. You can put shapes on multiple data points using thechmparameter, but to do this, you do not specify thechmparameter multiple times in your URL (for example, WRONG:chm=square&chm=circle&chm=triangle). Instead, parameters that take multiple values use a delimiter, such as a comma or vertical bar, between multiple values in the same parameter. Forchm, it is a bar, so you'd have something like this: RIGHT:chm=square|circle|triangle. See the details of each parameter to learn how to specify multiple parameters. - Build your URL string. The URL starts with
https://chart.googleapis.com/chart?and is followed by all your required (cht,chd,chs) and optional parameters. Note: If you are using your URL in an<img>tag, you'll have to change all your&characters to&in your link. Example:<img src="https://chart.googleapis.com/chart?chs=250x100&chd=t:60,40&cht=p3&chl=Hello|World" />. - Use GET or POST to get your image. GET, is either when you
type the URL directly into your browser, or use it in an
<img>tag. However, URLs are limited to 2K in length, so if you have more data than that, or have a taste for blood, you should consider using POST instead, as described here. - Create clickable regions. You can optionally create an image map for the chart that will let you add hyperlinks or click elements to specific chart elements. See Creating a Chart Image Map for details.
Glossary of Chart Terms
Here are a few important terms that we use in this documentation:
- Series
- A related set of data in a chart.
What constitutes a series depends on the chart type: in a line chart, a series
is a single line; in a pie chart, each entry is a slice, and
all slices together are a series. In a bar chart, a series is all the bars from
the same set of data; different series are either grouped side by side or stacked
atop each other, depending on the bar chart type. The following chart demonstrates
a grouped bar chart with two series, one in dark blue, one in light blue:
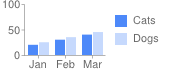
- Axis labels
- Numeric or text values along each
axis. In the previous chart, it would be the labels "Jan," "Feb," "Mar,"
"0," "50," "100."
Chart Components
Here are some of the components of a chart:
- Chart area
- The area showing the series art. See "Chart Components" sidebar for more details.
- Legend
- A small area on the chart describing the series. In the chart above, it is the section that lists "Cats" and "Dogs".
- Parameter
- A key=value pair used in the
URL. For example:
chxt=x, wherechxtis the parameter name andxis the parameter value. - GET and POST
- Two methods of sending your
Chart URL. GET is typically done either by typing a URL in the browser, or by
making it the source of an
<img>tag. POST requests are more complex to make, but can include much more data. The main reason to use POST instead of GET is that a POST request can take much more data than a GET request (16K characters vs 2K characters). POST is covered here. - Pipe character
- The
|character, often used as a parameter value delimiter—that is, a character to break up multiple values. Commas and ampersands (&) are also used as delimiters in the Chart URL. - Compound charts
- A chart that is a combination of two different chart types: for example, a bar chart with a line, or a line chart with candlestick markers. See Compound Charts.
Optimizations
Now that you've learned the basics of making a chart, here are a few optimizations that you can use.
Improving Performance on Pages with Many Charts
If you have just a few charts on your page, the standard base URL https://chart.googleapis.com/chart should
be fine. However, if you have many charts, you can add a number 0-9 and a dot
just before chart.apis.google.com. If you specify a different number
for each chart on your page, the browser will try to load more images simultaneously,
rather than waiting to load them in sequence. However, you should only need this
if you're loading perhaps five or more charts on a page. For example:
http://0.chart.apis.google.com/chart?cht=...http://1.chart.apis.google.com/chart?cht=...http://2.chart.apis.google.com/chart?cht=...- ...
Note that to use this technique you'll have to use a different host name in
the URL (chart.apis.google.com rather than the usual
chart.googleapis.com), and use http instead of
https.
Using POST
URLs are limited to 2K in length, so if your chart has more data than that, you'll
have to use POST instead of GET, as
described here. GET is when you
type your chart URL into your browser URL bar, or use it as the source of an <img>
element in a web page. POST requires additional programming in another language,
such as PHP or PERL.
Making Charts in JavaScript
You can use the Google Visualization API to create image charts for you. The Google Visualization API is a JavaScript-based API that gives you tools to to create, filter, and manipulate data, or to query Google Spreadsheets or other sites for data. You can use the Visualization API to create your data, then have it call the Image Charts API to render the chart on the page. For more information, see the Generic Image Chart documentation, or look in the Visualization gallery for any Google charts marked (Image).